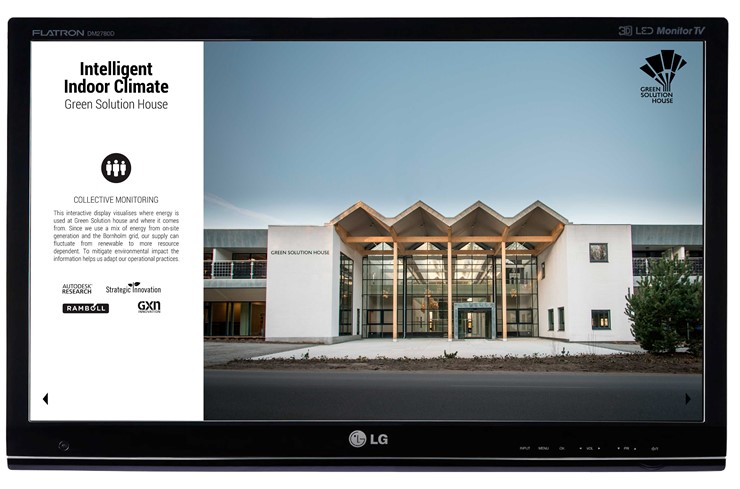
Correlating Use to Supply
At Green Solution House we know where our energy comes from and where it goes. The interactive energy visualisation in our lobby both tracks our energy footprint and correlates it to carbon and resource impact. On-site we produce our own energy for consumption, and make up the difference between demand and production by either consuming energy from, or selling it back to, the Bornholm grid. Aligned with our goal of continuous improvement we want an ongoing and thorough understanding of the resource mix used to produce our power – this means understanding the fluctuations between highly renewable energy and highly resource dependent energy. With this understanding, we correlate our operational practices to best mitigate environmental impacts. Together with the day-to-day operations, our guests influence our consumption profile; as such, our energy visualisation is an interactive learning tool – correlating the characteristics and impact of use to behaviour and routine.
Who’s behind it:
GXN Innovation, Autodesk Research, Strategic Innovation, Rambøll
Where you’ll find it:
In the communications room.
